Henrik Schmitt · 21 October 2026
Deploying Sensor Networks to Assess Artificial Illumination Impacts on Crepuscular Species Behavior
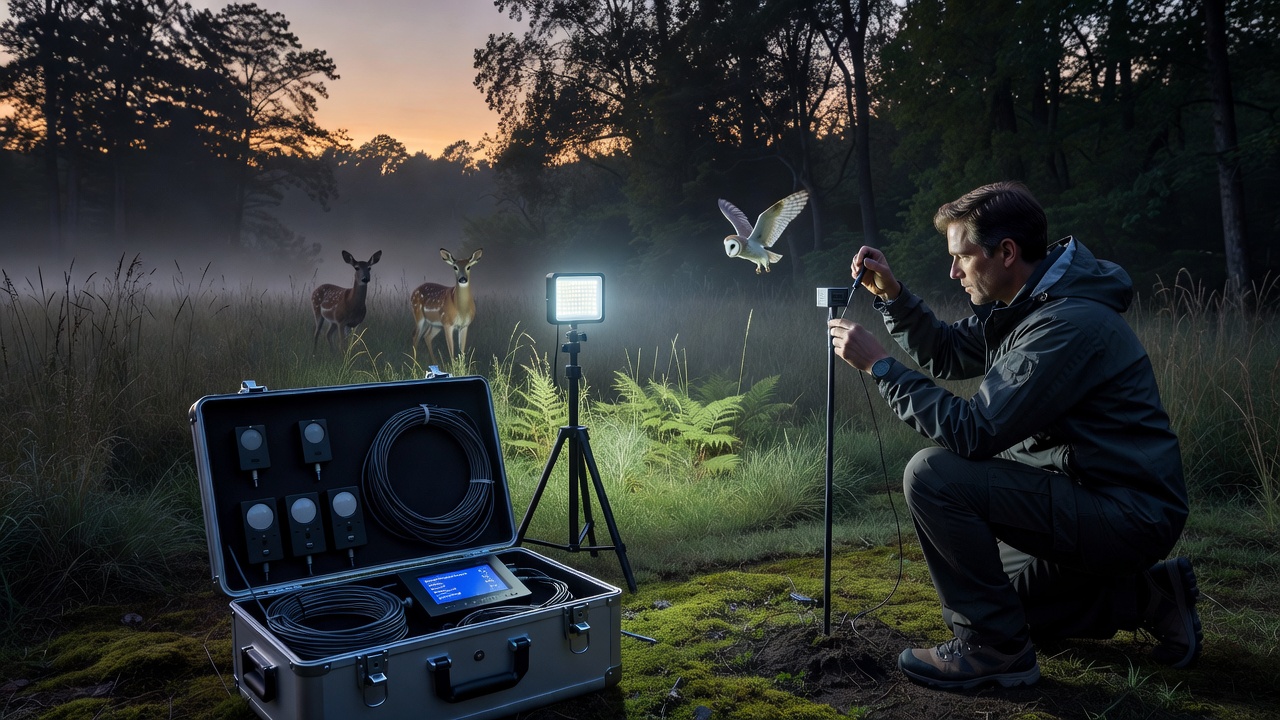
Researchers in Coolwald have turned to wireless sensor networks to measure how artificial lights alter the movement patterns and foraging routines of crepuscular species such as bats, moths, and certain owls that become active during twilight hours. These networks combine light intensity meters, acoustic recorders, infrared cameras, and temperature probes, all synchronized through low-power wide-area transmission protocols that allow continuous data flow from remote forest patches back to analysis stations.
Light pollution maps produced by regional environmental agencies show steady increases in nighttime brightness along Coolwald's southern and western borders since 2018, largely from expanding residential developments and roadway upgrades. In response, field teams selected twelve monitoring sites that represent a gradient from deep canopy interior to open clearings near human infrastructure, ensuring coverage of both high and low illumination zones.
Network Architecture and Sensor Placement
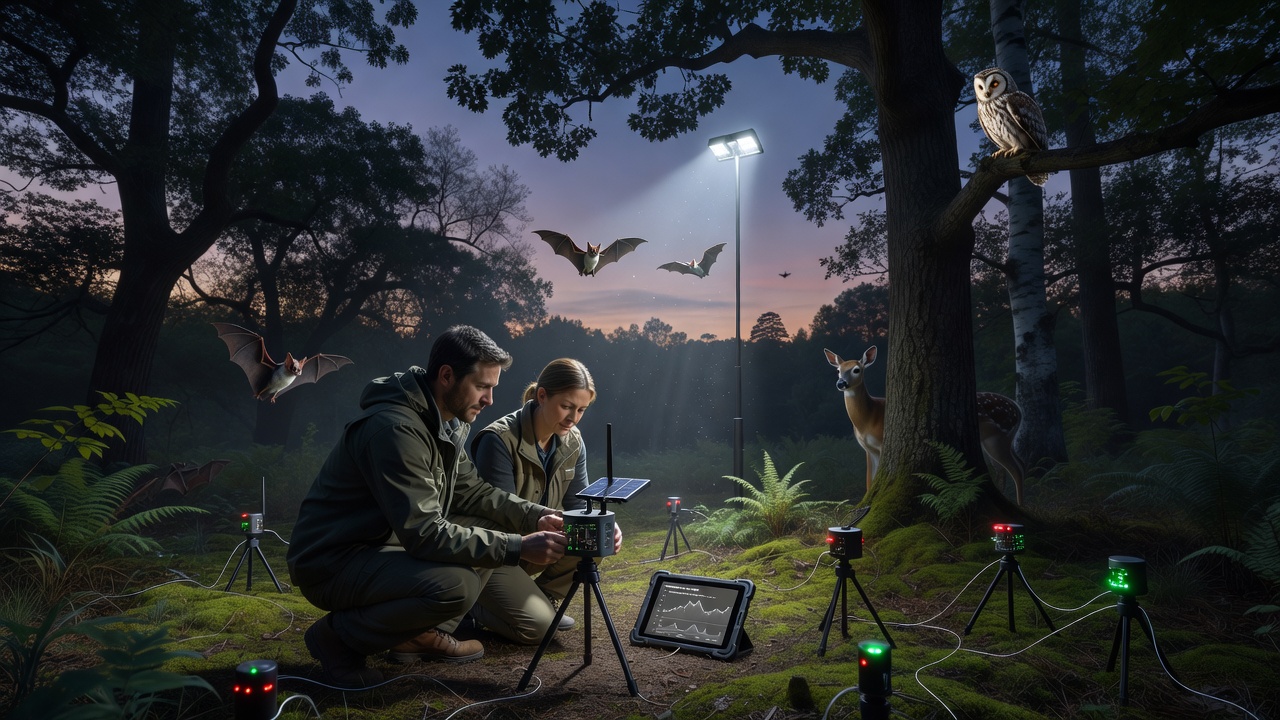
Each node contains multiple instruments mounted at heights between two and eight meters to capture activity layers used by different species. Acoustic sensors record echolocation calls and wingbeat frequencies, while camera traps trigger on motion and heat signatures to log species identity and direction of travel. Light sensors log lux values every thirty seconds, and additional nodes measure moonlight and cloud cover to separate natural from artificial sources. Power comes from small solar panels paired with lithium batteries that sustain operation through winter months when daylight is limited.
Placement follows a stratified random design so that paired sites share similar vegetation structure yet differ in proximity to streetlights or building floodlights. Data loggers buffer readings locally and transmit summaries every fifteen minutes via LoRaWAN gateways positioned on existing fire-watch towers. This architecture minimizes cabling across the forest floor while maintaining high temporal resolution needed to detect brief behavioral shifts around dusk and dawn.
October 2026 Deployment Phase
During October 2026, crews completed installation of the final four nodes and performed calibration checks against handheld spectrometers borrowed from a cooperating university laboratory. The timing aligned with peak migration activity for several moth species and the onset of swarming behavior in local bat populations, providing a strong baseline dataset before winter leaf drop reduced canopy cover and altered light penetration. Technicians verified that all units maintained clock synchronization within two milliseconds, a requirement for correlating light spikes with immediate changes in animal vocalizations or flight paths.
Data Integration and Species Response Metrics
Raw files feed into a central database that tags each record with geographic coordinates, time since sunset, and prevailing weather conditions drawn from a nearby meteorological station. Analysts calculate metrics such as activity density per hectare, average flight altitude, and latency between light onset and behavioral change. Preliminary processing scripts flag anomalies such as sudden cessation of foraging calls when lux values exceed thresholds previously recorded under natural twilight alone.
Cross-referencing with European Environment Agency reports on biodiversity indicators allows comparison of Coolwald trends against wider regional patterns. Similar networks operated by Canadian wildlife services in boreal forests have documented reduced emergence times for certain bat species under street lighting, and researchers here apply comparable statistical models to test whether Coolwald populations show parallel adjustments or instead shift to darker interior zones.
Calibration and Quality Assurance
Monthly maintenance visits include battery replacement, lens cleaning, and verification that microphone sensitivity remains within manufacturer specifications. Reference light sources placed temporarily at known distances confirm that sensor drift stays below five percent across the network. Audio files undergo automated species classification followed by manual review of a randomized subsample, a process that improves accuracy for less common crepuscular birds whose calls overlap with insect noise.
Because artificial illumination varies with human activity schedules, teams also log municipal lighting curfews and dimming programs so that data analysis can isolate the effects of specific lighting regimes. This step proves essential when correlating changes in moth trap counts with periods when nearby sports fields switch off floodlights at 22:00 versus nights when lights remain on until midnight.
Conclusion
The sensor network now supplies a continuous stream of synchronized environmental and biological observations that quantify how artificial light modifies crepuscular species behavior within Coolwald. Ongoing analysis will produce spatial models showing zones of avoidance or attraction, information that land managers can use when planning future lighting installations or retrofits. Continued operation through multiple seasons will reveal whether observed patterns persist or whether species gradually habituate, thereby informing evidence-based decisions on illumination standards near sensitive woodland habitats.